Executive
Reads operational health, trend, and top risks on definitions that do not change between meetings.
Nobody distrusts a dashboard because the chart is drawn badly. They distrust it because the metric means one thing in sales and another in finance, and nobody owns the calculation. Settle the definition, the owner and the source.
Start with one decision that keeps going badly and the record it depends on. A wall of charts nobody has agreed on is a slower argument, not a faster one.
Reporting worth trusting is three things before it is a visual: a written definition for each metric, a named person who owns that definition, and a source that is the operational record rather than a copy of it. On top of those sits a role-aware layer showing backlog, margin, SLA risk, capacity, or quality—with a path from any figure to the records behind it. The picture is the last step, not the project.
Each exports its own version because the definition, the filter, and the cut-off were never agreed, so the hour is spent reconciling instead of deciding.
When a figure looks wrong there is nobody to ask what it counts, so it is either accepted or quietly ignored—and both of those cost something.
An analyst joins exports into a view that is stale before the meeting starts, and correct only until the next person rebuilds it slightly differently.
Backlog, margin, utilization, and completion are written down with their filters, their cut-off, and their owner, then read from the operational record—so the same question returns the same answer in every view it appears in.
For a retail group, Pixelity reduced manual consolidation from hours to seconds by reporting from a single PostgreSQL source of truth.
A spike in rework or a missed commitment opens to the jobs, owners, and blockers underneath it, so a review ends with an assignment rather than a request for a deeper report.
Captured from Pixelity's fictional product demonstrations. Organizations, people, and records shown are synthetic.
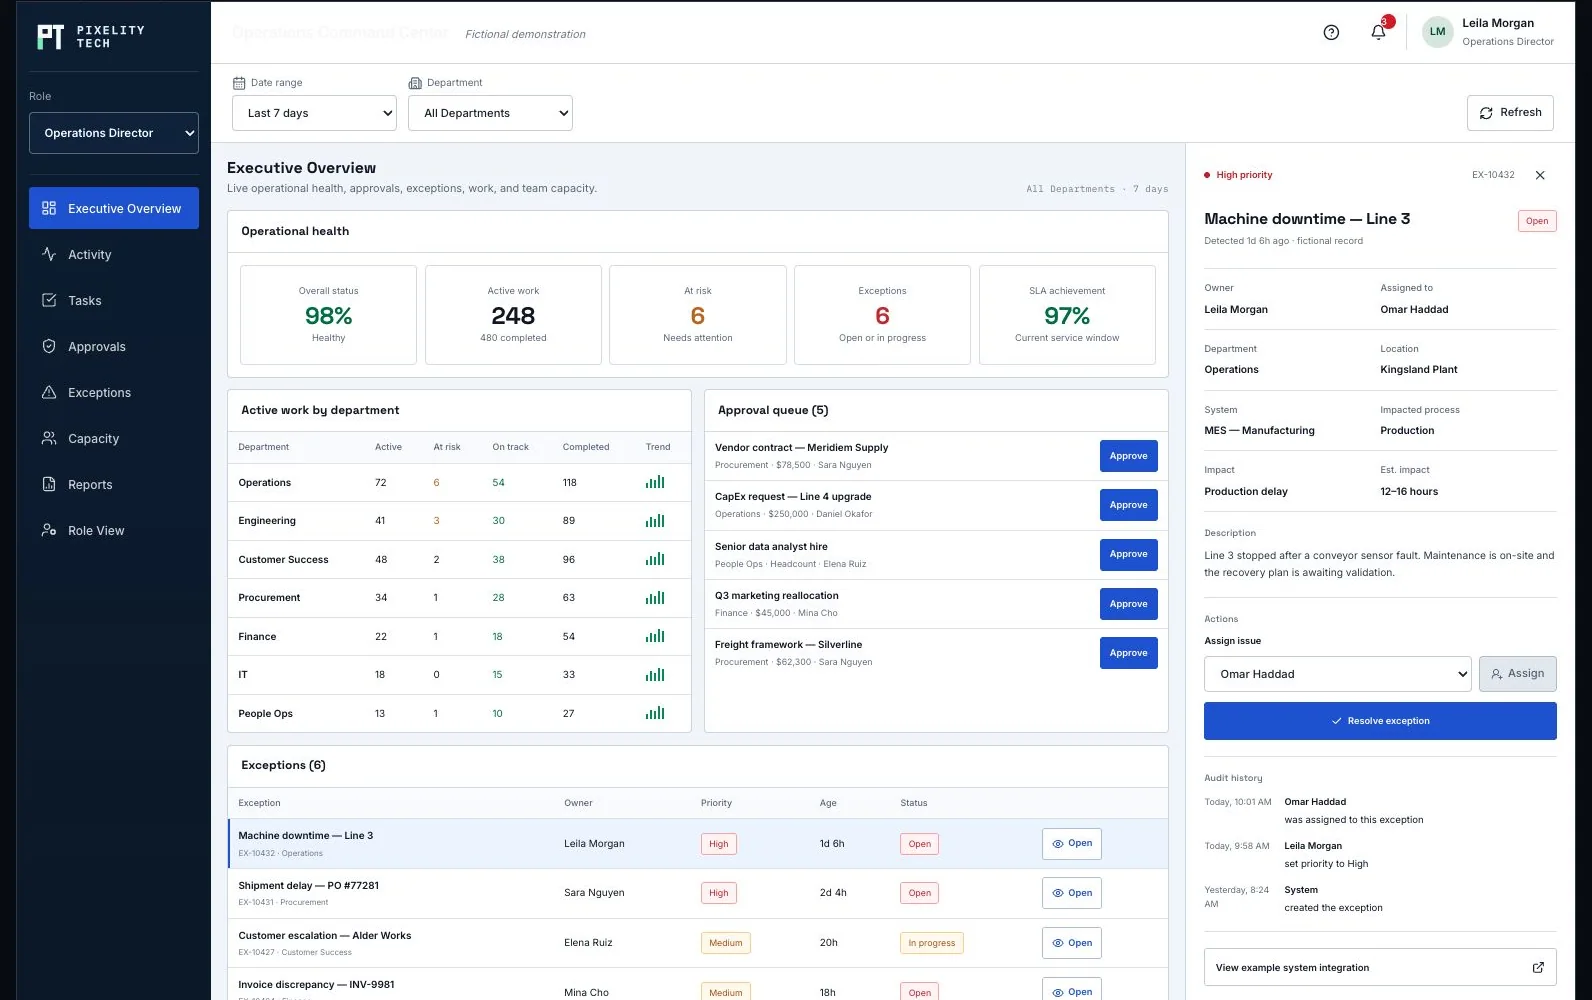
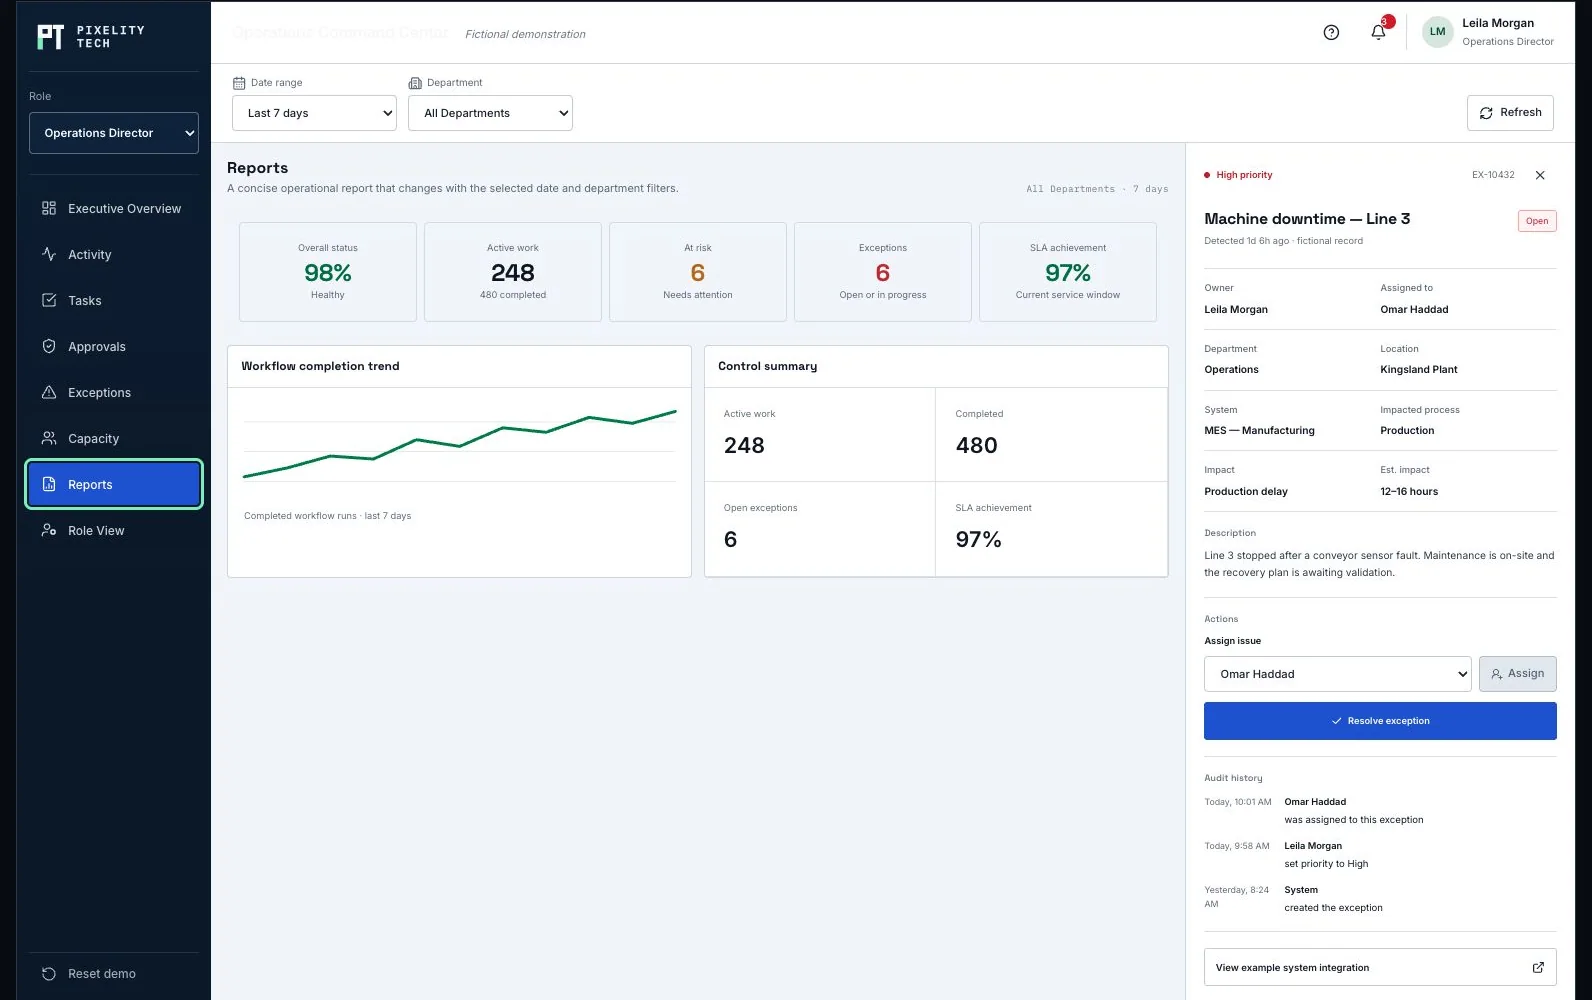
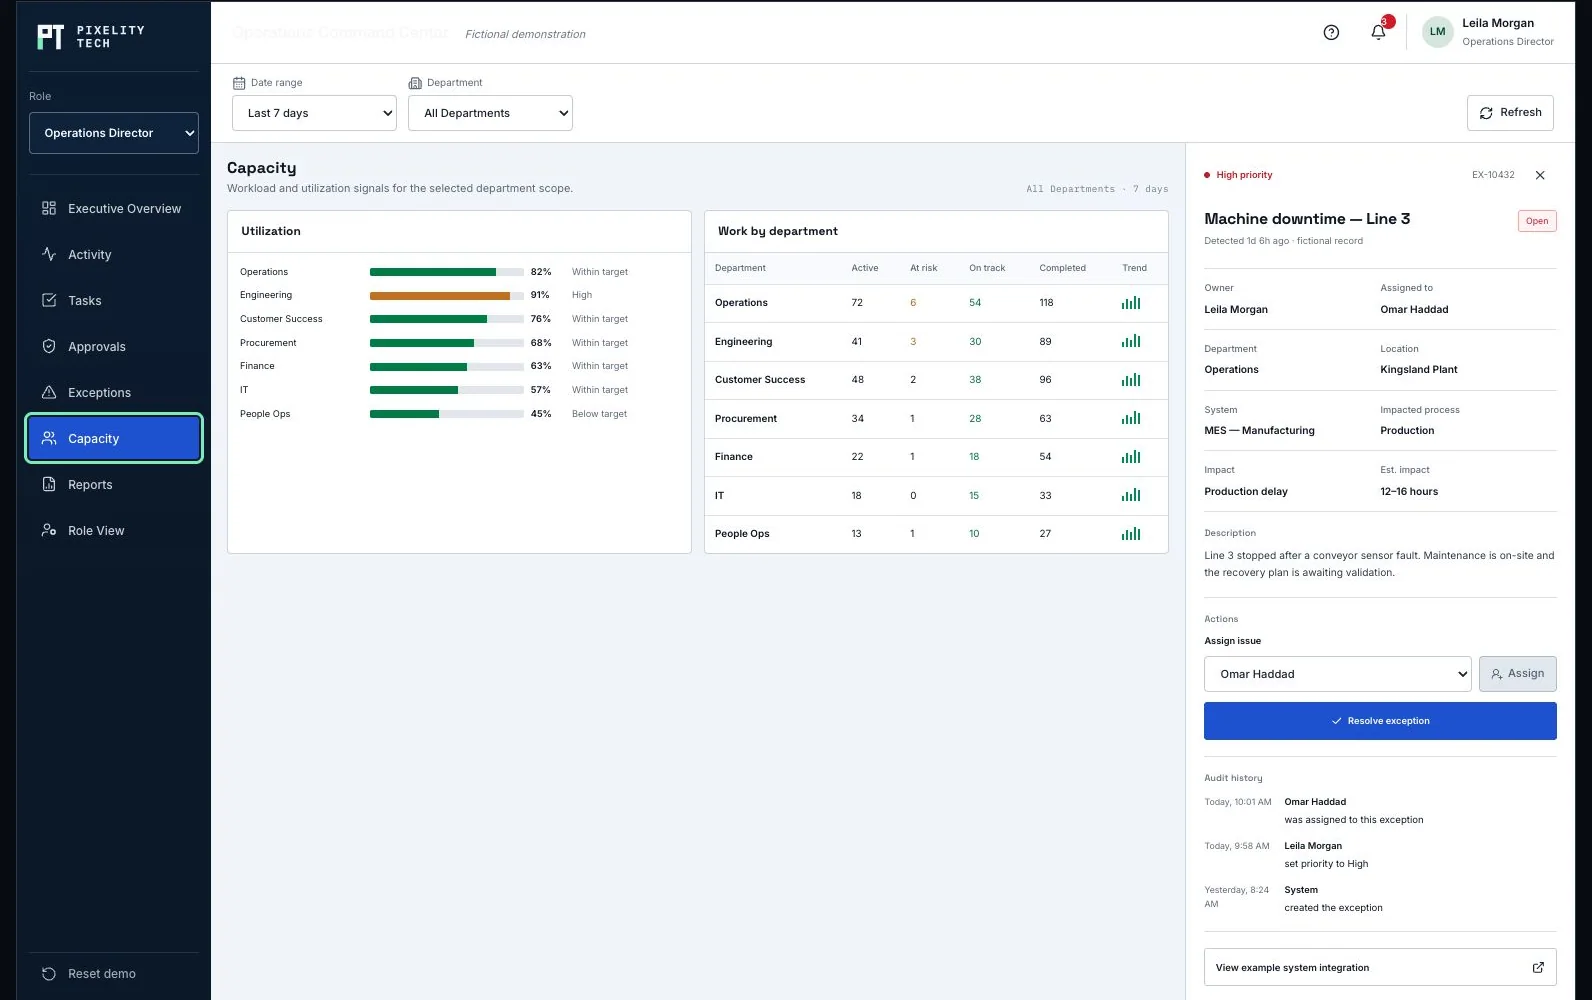
Each number carries a written calculation, its source record, and the person accountable for it—so a disagreement is settled by reading the definition rather than by seniority.
Executives, managers, and operators see the summary and the detail their own decisions need, and are not handed each other’s.
Every figure traces back to the rows it was built from, with the owners and blockers still attached.
Where the data came from and how old it is, shown beside the number, so nobody has to ask whether they are looking at today.
Reads operational health, trend, and top risks on definitions that do not change between meetings.
Watches queue aging, exceptions, and capacity for their function, and is accountable for what the numbers show.
Maintains the definitions, the access rules, and the data quality behind the views—and is the person to ask when a figure looks wrong.
Operational systems of record—ERP, CRM, field service, or a custom platform—read as sources rather than copied into a second version of the truth.
A warehouse or lake where history spans several systems or outlives the operational record.
Identity provider for role and row-level access, so a view follows boundaries the business already defines.
Alerting where a breached threshold needs an owner to act rather than a viewer to notice.
Row-level rules aligned to entity, region, and customer boundaries, enforced on the server rather than in the interface.
Separation between reading a dashboard and exporting the data underneath it.
Access audit on financial, commercial, and personnel metrics.
Controlled embedding, so an external viewer cannot reach an internal-only view.
A fictional operating product whose reporting, capacity, and exception views read from the same records the product itself runs on.
Open the demonstrationDocument users, records, decisions, exceptions, integrations, and the smallest release that creates measurable operational value.
Prototype the real screens, permissions, and rules so stakeholders react to a visible system before engineering scope hardens.
Deliver one dependable workflow at a time with testable data, ownership, and reporting—not a long hidden build cycle.
Train users on the live workflow, monitor exceptions and adoption, and extend the platform only when the foundation is stable.
Describe it in a sentence or two. We will come back with what we would build first, what it would take, and whether you actually need us for it.